


Software projects succeed or fail based on the quality of the teams behind them. Expert developers can be hard to find. So how do you get junior developers to level up? It’s not enough to teach how to use a framework or tech stack. Good developers can follow a pattern.

Software projects succeed or fail based on the quality of the teams behind them. Expert developers can be hard to find. So how do you get junior developers to level up? It’s not enough to teach how to use a framework or tech stack. Good developers can follow a pattern.

This cheat sheet is an adjunct to our Definitive TypeScript Guide. Originally published November 2018.
Not long ago, good design was considered nice to have, but non-essential to a product or company. In today’s market, however, good design has become a commodity.

Did you know that a desktop browser has almost everything you need to make video calls? A client-side web app can use the WebRTC API, which is built into modern browsers, to access a system’s camera(s), start a video stream, and connect to a remote system, all without requiring any third party plugins.
Originally published October 2018. Updated March 2023. This article describes the features and functionality of TypeScript 5.0. One of the most interesting languages for large-scale application development is Microsoft’s TypeScript. TypeScript is unique in that it is a superset of JavaScript, but with optional types, interfaces, generics, and more.
Modern times have seen an explosion in services providing a multitude of serverless possibilities, but what is serverless? Does this mean there are no servers? You’d think, but no.

Redux-Saga is an intuitive side effect manager for Redux.

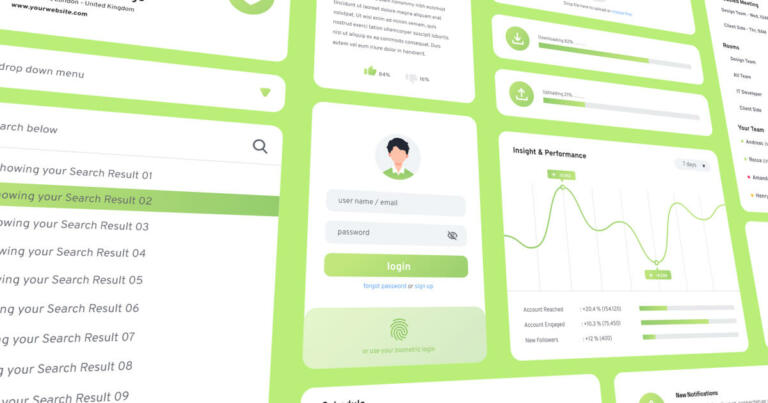
Let’s be honest, getting designs from your UX team into the hands of your engineering team in a way that makes sense is rarely easy. Add tight deadlines, team changes, and miscommunication to this process, and your application will likely end up looking very different than what you expected.

News about AI is everywhere right now. Whether it’s ChatGPT or Stable Diffusion, we’re using AI algorithms to generate text and images.

Use the File System Access API to read, write, and edit files on the local file system directly from the browser.

Receive Our Latest Insights!
Sign up to receive our latest articles on JavaScript, TypeScript, and all things software development!