


Introduction
Outline
Traditionally, front-end performance focused primarily on page load times as an important performance metric. Commercial web performance dashboards would show granular level performance metrics for back-end aspects, like database lookup times, template compilation, server response times, etc.
However when it came to the client-side, performance information was limited. This is partly due to limited performance metrics & APIs browsers would offer. Ironically, some non-standard performance tracking techniques would themselves negatively impact performance. This is now changing thanks to new performance oriented APIs:
Here we will focus on the Paint Timing API, which marks two significant moments in the browser rendering pipeline: First Paint & First Contentful Paint.
Paint metrics answer two useful questions for the user about your page:
- Is something happening? (First paint)
- Is this useful? (First contentful paint)
it is important to measure performance, but even more important to measure an end user’s perceived performance, which is typically influenced by these two metrics.
First Paint
This is the first render to the screen, this metric excludes the default background paint however it includes any user defined background paint, it is the point at which pixels are first drawn to the screen.
First Contentful Paint
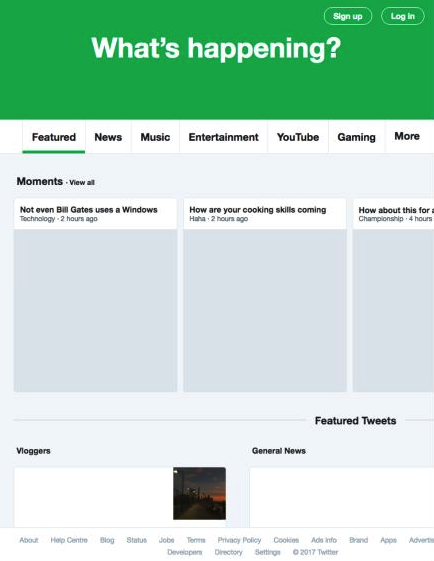
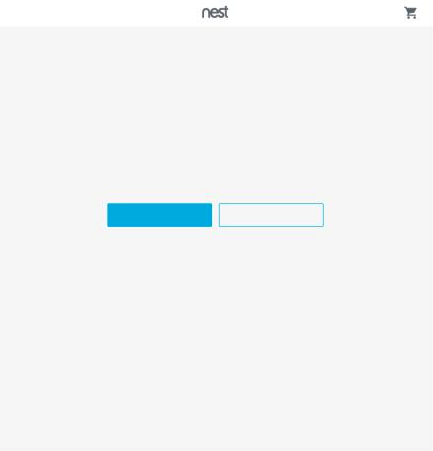
This is the point at which the browser renders the first piece of DOM to the screen. This metric reports the time when the browser first rendered any text, images, canvas, or SVGs.
It represents the first point at which a user can start consuming content. For example, the Twitter and Nest home pages may look like this:
Understanding the difference with code
To solidify your understanding of first paint vs. first contentful paint, consider the following code example which is also present on GitHub.
<!DOCTYPE html>
<html lang="en">
<head>
    <meta charset="UTF-8">
    <title>Paint delay example</title>
    <script>
        const observer = new window.PerformanceObserver(list => {
            list.getEntries().forEach(({name, startTime}) => {
                console.log({name, startTime});
            });
        });

        observer.observe({
            entryTypes: ['paint']
        });

        function sleep(ms = 1000) {
            return new Promise(resolve => setTimeout(resolve, ms));
        }

        // This triggers first-paint
        sleep().then(() => document.body.style.backgroundColor = 'lightgrey');

        // This triggers first-contentful-paint
        sleep(2000).then(() => document.body.innerHTML += '<p>Hi there!</p>');
    </script>
</head>
<body>

</body>
</html>
Note from the author: The code example above does not highlight best practices in any way! For example, setting inline styles in this manner should be avoided. It is only used as a demonstration.
Before we move onto the output from viewing this page, take note of the PerformanceObserver() API usage. This API allows you to observe various performance metrics in your application source code and then act upon them, for example by sending metrics to a server for further processing.
Here is the result from the console panel when viewing the page:

Notice the following metrics:
- First paint occurs around the one second mark
- First contentful paint occurs around the two second mark
These metrics can be directly linked to code which triggers these metrics to occur. This code in particular triggers first paint:
sleep().then( () => document.body.style.backgroundColor = 'lightgrey' )
First paint may not always offer great value to understanding the user’s perception of performance, however it is correctly identified as the first point at which pixels are drawn to the screen.
This code below triggers first contentful paint.
sleep(2000).then(() => document.body.innerHTML += '<p>Hi there!</p>')
In this case, real content is drawn to the page after two seconds.
While this is an intentionally contrived and simple example, it should demonstrate the various triggers for first paint and first contentful paint.
1 Accessing paint metrics from JavaScript
Approach 1: Querying for paint metrics
There are two approaches for assessing paint metrics. For the first approach, you can open Chrome DevTools right now and try this line of code in the console panel:
performance.getEntriesByType('paint')

You can use the Performance API, specifically Performance.getEntriesByType(), to retrieve available performance metrics. For the first paint metric, an individual performance entry looks like this:
{
  "name": "first-paint",
  "entryType": "paint",
  "startTime": 1494.9050000000002,
  "duration": 0
}
As part of the JSON object returned from a call to Performance.getEntriesByType(), there are four properties:
- Name: The individual metric name
- Entry Type: The category type to which this metric belongs (Note: this is the key to use to filter for metrics which belong to a specific category:
Performance.getEntriesByType('paint')) - Start Time: A high resolution timestamp which represents the time at which the metric occurred
- Duration: For paint metrics, this will always be zero, since the first-paint and first-contentful-paint metrics do not represent durations, but rather, specific points in time
Approach 2: Listening for paint metrics
The first technique to acquire paint metric events invokes a targeted method in JavaScript to return all available paint metrics. This second approach involves listening for changes by registering an observer. In practical terms, this means creating a performance observer instance:
const observer = new PerformanceObserver(list => {
    // `list` provides access to performance metrics
});

observer.observe({entryTypes: ['paint']});
The performance observer interface allows you to observe for particular types of performance metrics. In the code example above, we listen for paint metrics. This observer patterns follows similar characteristics to the observable proposal in JavaScript, an interface allowing you to listen for a collection of data over time.
2 Reporting paint timing metrics to a server
To derive value from paint metrics, you can automatically capture metrics from the client and report them to your server for analysis and processing. We will cover two approaches, the first approach involves using Google Analytics, and the second approach uses a slightly more vanilla approach to send performance metrics to a Node.js web server.
Approach 1: Google Analytics
Using Google Analytics, you can send across paint metrics to the analytics dashboard:
ga('send', 'event', {
    eventCategory: 'Paint Metrics',
    eventAction: 'first-paint',
    eventValue: 100,
    nonInteraction: true,
});
This process is documented in further detail in Leveraging the Performance Metrics that Most Affect User Experience. Google Analytics also offers dedicated user timing documentation for reporting timing information.
Approach 2: Reporting metrics to a Node.js web server
This approach involves collecting paint timing metrics in client-side JavaScript code, and then using an appropriate API to send the metrics to a web server. The complete client-side code and server-side code is on GitHub.
Here’s the starting point of the client page:
<!DOCTYPE html>
<html lang="en">
<head>
    <meta charset="UTF-8">
    <title>Reporting to Node.js</title>
    <script>
        const observer = new window.PerformanceObserver(list => {
            list.getEntries().forEach(({name, startTime}) => {
                console.log({name, startTime});

                // Need to report to a server here
                const data = {
                    name,
                    startTime
                };

                navigator.sendBeacon('http://127.0.0.1:3000', JSON.stringify(data));
            });
        });

        observer.observe({
            entryTypes: ['paint']
        });
    </script>
</head>
<body>

    <p>Hi there</p>

</body>
</html>
The forEach() callback finally gives us access to paint timing metrics. At this point, it would be fairly trivial to execute a fetch() request with the Fetch API and submit the paint timing metrics as query string parameters or as a POST body payload. There is another API suitable for this use case supported in almost all modern browsers, the Beacon API, which provides an excellent candidate for beaconing metrics to a server:
- Beacons can be sent even after a page has been closed
- Beacons are sent asynchronously meaning they do not block the main thread upon invoking the API
- Beacon requests are scheduled by the browser to not compete with high-priority network requests
- Beacon requests can be coalesced by the browser to be sent more efficiently on low powered devices
- Beacon requests do not block user interactivity
Using the beacon API from client-side JavaScript with the performance observer is relatively straightforward:
list.getEntries().forEach(({name, startTime}) => {
    const data = {
        name,
        startTime
    };

    navigator.sendBeacon('http://127.0.0.1:3000', JSON.stringify(data));
});
The server component (Node.js) can receive data using the Micro server:
const {json} = require('micro');

module.exports = async req => {
    console.log(await json(req));
    return 200;
};
Notice the very minimal amount of source code required to get this simple example working!

The screen above demonstrates the end result: to retrieve structured performance data on the back-end. You can incorporate these techniques into your production website and use it to raise awareness of paint performance within your team. For example, from Node.js you can:
- Send paint metrics into a visualisation platform like Graphite
- Incorporate metrics within an alerting or monitoring platform like ZMON
- Include the
first-contentful-paintmetric in your automated tests so that page tests fail when they exceed an acceptable first contentful paint time. You can do this with a testing tool like Intern
3 Viewing paint metrics in the Chrome DevTools
Chrome DevTools has an experimental feature which allows you to see paint timing metrics overlaid on a performance panel recording.

In the screenshot above, notice dashed vertical lines going down the recording. These vertical lines indicate significant milestones in a page load. Milestones can include:
- First paint
- First meaningful paint / First contentful paint
- Page load
You can hover over the topmost portion of the dashed vertical lines to identify which metric the line belongs to.

In the screenshot above, the dashed vertical line represents the first meaningful paint. You can view the related screenshots to understand which visual components were on the page at this point in time. In this example, the header and page heading were drawn.

Here’s a quick screencast demonstrating this feature if you’d like to follow along:
If you would like to try this yourself, ensure the ‘Timeline: paint timing markers’ experiment is enabled within Chrome DevTools. This has been verified in Chrome version 63.

You should also enable the ‘Screenshots’ checkbox in the performance panel, so that you can relate the visual completeness of a page along with paint timing markers:

4 Browser Implementations
There are web platform tests for paint timing. While targeted at browser vendors, they can offer you, a web developer, some extra insight into how paint timing should behave. For example:
- first-contentful-bg-image.html demonstrates how first contentful paint is triggered upon a background image download
- first-contentful-canvas.html demonstrates how first contentful paint is triggered after rendering a non blank canvas
If you are still curious, you could even dive into the Chrome source code to familiarise yourself with first paint behaviour. For example:
- This
PaintTiming::MarkFirstPaint()function appears to be the handler for first paint indicators - Within the SVGRootPainter.cpp file, presumably responsible for painting SVGs, there is the line of code:
timing.MarkFirstContentfulPaint(). An interesting takeaway here is observing the exact point at which the first contentful paint metric is marked
Further reading
- Paint Timing API – Specification
- Performance Paint Timing – MDN
- Time to First Meaningful Paint – A layout-based approach
- First Meaningful Paint – manual evaluation
- Time-to-first-X-paint metrics: status and refinement plans
Conclusion
We covered a wide spectrum of topics related to paint timing. We took a deeper look at what the first paint and first contentful paint metrics represent, and how the visual completeness of a page relates to these metrics. We saw how to retrieve these metrics in JavaScript and also send them to a remote web server with the Beacon API.
Finally, we saw an experimental Chrome DevTools feature which overlays paint timing metrics onto the performance panel recordings, making it easier to align paint events with activity on the page.
The paint timing API enables website creators to track and monitor the important metrics which affects perceived performance. Consider that 53% of users will abandon a site if it takes longer than 3 seconds to load (source). Being able to keep your paint times low is likely to keep your users happy and improve the perceived performance of your site.
The paint timing API is currently in Chrome stable.